Every litre of water and every kilowatt behind every litre of milk.
Aqueduct meters process water, CIP, refrigeration, boiler and steam, compressed air and effluent across a working dairy, line by line and shift by shift, without interrupting production. Live data in 2 to 6 weeks.
A dairy plant consumes between 1 and 7 litres of water for every litre of milk it processes, and roughly 75 percent of that water goes to clean in place. Refrigeration takes 50 to 60 percent of plant electricity, while about 80 percent of total energy is spent generating steam and hot water. Aqueduct meters each of those flows non invasively, reconciles them into one balance that has to add up, and raises the alarm within minutes when it does not.
Milvian works with one of Andhra Pradesh's largest dairy operations and with a large North India dairy and ghee operation in the Uttar Pradesh belt. In both, the pattern was identical: every unit knew its monthly bill and no one could say which line, which shift or which cleaning cycle had spent it. This page sets out the utility problem in a dairy, the regulatory clock in the USA, Dubai and India, and what a metered plant looks like ninety days later.
Why a dairy plant is the hardest utility bill in food processing
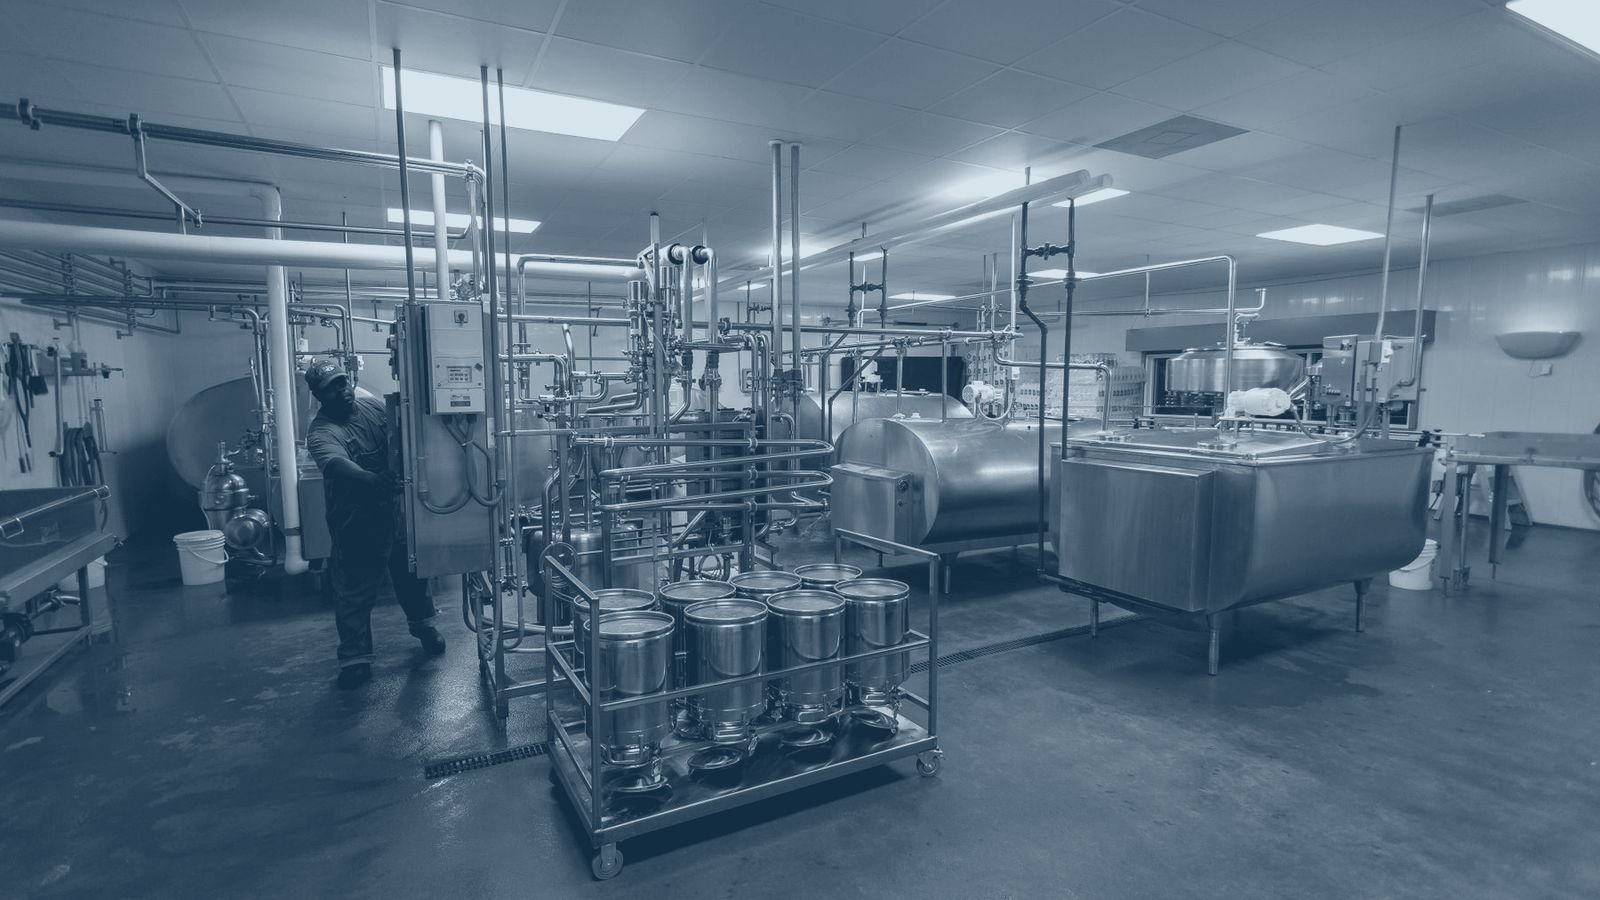
A dairy is not one process. It is a milk reception bay, a chilling hall, pasteurisers, separators, evaporators and dryers, a CIP skid running around the clock, a boiler house, an ammonia or glycol refrigeration plant, a compressed air ring main, an RO polishing loop, an effluent treatment plant, and a cold chain that reaches out to hundreds of village level chilling centres. Each of those consumes a different utility, on a different rhythm, and almost none of them are individually metered.
The result is the single most common finding on a dairy survey: one number on the bill, and no line item behind it. When the bill jumps, the plant team can only guess whether it was a burst line, an extra CIP cycle, a fouled evaporator, a compressor short cycling, or simply more milk.
01
CIP is invisible and it dominates
Clean in place accounts for close to 75 percent of total water consumption in dairy plants, and in United States dairies roughly half of the 21 billion gallons used annually goes to CIP. Cleaning cycles are usually run to a fixed recipe and a fixed time, not to a measured endpoint, so over cleaning never shows up as an error.
What it costsA single unmetered CIP skid running a fixed rinse recipe can spend more water in a week than an entire packing hall.
02
Refrigeration runs the electricity bill
Refrigeration accounts for roughly 50 to 60 percent of total electrical consumption in dairy processing. Compressor efficiency drifts slowly with fouled condensers, wrong suction pressure, iced evaporators and doors left open. Nothing alarms, because the product stays cold. It just costs more to keep it there.
What it costsA few degrees of avoidable condensing pressure across a compressor bank is a permanent tax on every litre for the rest of the year.
03
Steam is 80 percent of the energy, and it leaks
Around 80 percent of a dairy's total energy goes to generating steam and hot water for pasteurisation, sterilisation, drying and cleaning. Without a preventive maintenance programme, roughly 20 percent of steam leaving the boiler house can be lost through failed traps, and distribution losses waste a further 10 to 20 percent in poorly maintained systems.
What it costsFailed traps and unreturned condensate are paid for three times: in fuel, in treated make up water, and in the chemicals to treat it.
04
Unaccounted water hides inside the intake
On a large multi unit campus, as much as 40 percent of supply can sit as unaccounted loss, in leaks, overflowing tanks, idle draw and hoses left running, until the site is properly metered. In a dairy that number is compounded by wash down culture, where running water is a hygiene habit as much as a process need.
What it costsUnaccounted loss is billed at the intake, treated at the ETP, and counted against you in the disclosure. You pay for the same litre three times.
05
The cold chain is a portfolio you never visit
Bulk milk coolers and village chilling centres sit far outside the plant fence, on unreliable grid power, with no telemetry. A failed compressor or a door seal at a chilling centre becomes a quality problem hours before anyone in the plant knows about it.
What it costsA rejected tanker is a full day of collection lost, plus the energy already spent chilling it.
06
The effluent plant is judged, not managed
Dairy effluent is strong: milk processing generates BOD of 500 to 1,500 mg per litre, and ghee and butter lines reach 1,500 to 3,500 mg per litre because of fat load. The ETP is sized for an average that the plant never actually runs, and shock loads from a CIP dump arrive without warning.
What it costsA single shock load can knock out a biological stage for days and put the discharge outside consent.
Every utility, mapped
The nine utilities running through a dairy, and what goes wrong in each
A complete utility intelligence layer has to cover all nine. Metering only electricity, which is where most plants start because the meter is already there, catches less than half the recoverable cost.
Dairy utility map
Utility
Where it goes
The usual failure
What Aqueduct meters
Process and potable water
Reception wash, product make up, RO feed, general service
Unaccounted loss at 20 to 40 percent of intake before metering
Clamp on ultrasonic flow at intake, per unit and per line, with a balance that has to reconcile
CIP and wash down
Rinse, caustic, acid, final rinse across every skid and tank
Fixed time recipes, over rinsing, no measured endpoint, close to 75 percent of plant water
Flow and conductivity per CIP circuit, litres and minutes per cycle, cycle by cycle comparison
Refrigeration
Ammonia or glycol plant, chilled water, cold stores, bulk coolers
50 to 60 percent of plant electricity, efficiency drift no one sees because product stays cold
Compressor level power, suction and discharge pressure, kW per tonne of refrigeration, run hours
Leaks routinely waste 20 to 40 percent of generated air, and 50 percent in untreated plants
Compressor kW, flow, pressure, off shift baseline demand as the leak signature
RO and water treatment
Boiler feed, product water, polishing
RO reject at 25 to 50 percent of feed sent to drain rather than recovered
Feed, permeate and reject flow, recovery percentage, membrane fouling trend
Effluent and STP
ETP, STP, reuse loops, discharge
Shock loads from CIP dumps, reuse claimed but not quantified
Discharge flow, reuse volume, load profile against consent, event correlation to the line that caused it
Air quality and environment
Processing halls, cold stores, packing, dryers
Comfort and hygiene conditions assumed rather than logged
CO2, PM2.5, VOC, temperature and humidity per zone, tied back to ventilation energy
Benchmark ranges are indicative and drawn from published industry sources listed at the foot of this page. A site survey replaces them with your measured numbers.
Nine utilities run through the same hall. Most plants meter one of them.
Three markets, three clocks
What is forcing the issue in the USA, Dubai and India
The dairy utility problem is universal. The reason it becomes urgent is local, and it is worth being precise about which pressure applies to your plant.
United States
Cost inflation and a voluntary but increasingly audited sustainability commitment.
Water is repricing
US water and sewer bills rose roughly 24 percent over five years, and utilities continue to file for further increases into 2026. Non revenue water sits near 16 percent nationally, which utilities recover through rates.
The sector has committed
The US Dairy Stewardship Commitment and IDFA back greenhouse gas neutrality by 2050 with optimised water use. Participation is self reported, which means the burden of evidence falls on the processor.
Benchmarks already exist
ENERGY STAR publishes a plant level energy performance indicator for fluid milk and yogurt processing. You cannot score against it credibly without sub metered data.
Where Aqueduct lands
Multi plant processors that need one comparable intensity number per plant, per litre and per shift, without waiting for a corporate data project.
Dubai and the UAE
Desalinated water, a cooling dominated grid, and green building rules that now bite in operation.
Every litre is manufactured
Gulf process water is desalinated or heavily treated. Even at Dubai's record low contracted rates, water carries an energy cost that a dairy pays twice, once at intake and again at the chiller.
Cooling is the bill
Up to 80 percent of a building's electricity demand in the UAE goes to cooling. In a dairy, refrigeration plus HVAC in an ambient of 45 degrees is the dominant load for most of the year.
The rules apply in operation
Dubai's Demand Side Management strategy targets a 30 percent reduction in electricity and water demand by 2030, and from 2026 Al Sa'fat Silver is the mandatory baseline for new building permits under Dubai Municipality.
Where Aqueduct lands
Food and dairy manufacturers in Dubai Industrial City and across the Emirates who have to evidence consumption per asset rather than estimate it.
India
Statutory disclosure, pollution control enforcement and the sheer scale of the cold chain.
Disclosure is now assured
BRSR Core requires reasonable assurance from an independent provider on water and energy intensity metrics for listed entities, which means spreadsheet estimates no longer survive the audit.
The pollution boards have real time eyes
CPCB general standards require outlet BOD at or below 30 mg per litre for inland surface discharge, and state boards now run real time monitoring with stronger enforcement powers.
Carbon markets are arriving
The Carbon Credit Trading Scheme is absorbing the PAT energy efficiency mechanism, with compliance obligations already live for energy intensive sectors and the framework widening.
Where Aqueduct lands
Large cooperative and private dairies with multi plant footprints and hundreds of chilling centres, where one measurement standard across the estate is worth more than any single plant retrofit.
The solution
Aqueduct: a brownfield intelligence layer over the dairy you already run
Aqueduct does not replace your plant systems. It sits on top of them. Non invasive sensors clamp onto existing pipes and panels, existing meters and PLCs are read over BACnet, Modbus, MQTT, OPC UA and vendor APIs, and everything normalises into one asset model. Nothing is ripped out, and production is never interrupted to fit it.
Water
aQ WaterGuard
A live water digital twin of the plant, built as an equation that has to balance.
Supply equals process plus CIP plus RO feed plus utilities plus unaccounted loss, reconciled every 60 seconds
When the equation stops reconciling, the loss term rises and the alarm is raised in minutes, not at the next bill
Minimum night flow and off shift baseline as the leak signature on every zone
Reuse quantified line by line: STP, RO reject, condensate and cooling blowdown
Energy
aQ EnergySmart
The same lens turned on electricity, refrigeration and steam.
Feeder and panel level load with power factor and peak demand before the utility bills them
Refrigeration plant efficiency tracked as kW per tonne of refrigeration, not just total kWh
Boiler fuel, steam flow, condensate return ratio and blowdown as one thermal balance
Smart controls on pumps, VFDs, AHUs and RTUs, each reporting health and estimated savings
Air
aQ AirSafe
Continuous environmental monitoring across processing, cold store and packing zones.
CO2, PM2.5, VOC, temperature and humidity logged per zone, continuously
Ventilation tied to occupancy and process need so fresh air follows demand
Evidence for hygiene and audit requirements without a manual log sheet
Intelligence
aQ Core
The portfolio brain across plants, chilling centres and bulk coolers.
Every site ranked and benchmarked by total, intensity and per litre of milk processed
Missing data flags, so an un instrumented unit is obvious on day one
Agentic AI that detects drift, diagnoses cause, ranks fixes by payback and raises the work order into your CMMS
Audit grade export for BRSR, GRI 303, CDP Water, ENERGY STAR and pollution board reporting
Clamp on instrumentation reads existing pipework without breaking into it.
Deployment
From site walk to live dashboard in about 90 days
The recommendation is never the whole estate on day one. It is one self contained, high intensity unit with a complete water and thermal story, instrumented end to end, as a lighthouse the rest of the business can see.
Day 0
Site survey
Walk the plant. Map water points, CIP skids, RO and STP loops, boilers, condensate return, electrical panels and refrigeration compressors. Wireless survey for gateway coverage. Pull 12 months of bills.
Week 2
Instrumentation plan
Sensor list, gateway layout and the water and energy balance model, for your sign off before anything is fitted.
Week 3 to 8
Phased metering
Non intrusive flow, pressure, level and power sensors fitted during normal running. Data starts flowing as each zone comes online.
Day 90
Live and first savings
Digital twin live and reconciling. First leaks and losses named, quantified in litres, kWh and currency, measured against the baseline.
First live data typically lands between 2 and 6 weeks from the first call. The full quarter is what it takes to have a defensible before and after, which is the number that actually unlocks the next unit.
Proof
Where this has already run
Dairy, Andhra Pradesh
One of the state's largest dairy operations
A high volume liquid milk, ghee and value added dairy operation. Process water, CIP circuits, refrigeration load and boiler thermal balance instrumented as one system rather than four separate departments.
Focus: CIP water per cycle, refrigeration kW per tonne, condensate recovery
Dairy and ghee, North India
A large Uttar Pradesh belt dairy and ghee operation
Ghee and butter lines carry the heaviest fat and effluent load in dairy. Metering the wash down and CIP volumes that drive that load turned an effluent problem into a measured process variable.
Focus: wash down volume, effluent shock loads, reuse quantification
Food and beverage campus, India
One of India's ten largest manufacturing campuses
Roughly 500 acres with dairy and ghee, beverages, edible oil refining, herbal extraction, milling and packaging on one site. A single water and energy intelligence layer across units that previously each read their own bill.
Focus: campus water balance, per unit benchmarking, BRSR grade records
Global water stewardship programme
A Fortune 1 water positive programme
Aqueduct deployed across the estate as one real time water intelligence layer supporting a public water positive commitment, with same day leak and anomaly detection replacing bill cycle discovery.
88 facilities monitored, 75,000 m3 of water saved
Aviation, United States
A top 25 US airport, live in 72 hours
Roughly 5,000 meter points instrumented across a 24/7 campus. Aqueduct surfaced a 9,000 gallon per day anomaly within 72 hours of go live, a find manual reads would have missed for months.
5,000 meter points, 72 hours to first find
The pattern
The first find usually pays for the year
Across deployments the same thing happens. Within the first week of live data, one loss appears that nobody knew was there, and it is almost always larger than the cost of the instrumentation that found it.
First live data in 2 to 6 weeks
Client names are withheld on this page where usage permission is still in progress. Reference calls can be arranged under NDA.
Deployment is scheduled around production. Nothing stops to fit a sensor.
Outcomes
What a metered dairy gets back
Outcome
What changes operationally
Who cares
Lower utility bills
Leaks, idle draw, over cleaning and power factor penalties become named line items with an owner and a payback
Plant head, finance
Faster detection
Bursts, overflows and demand spikes are caught in minutes rather than discovered at the next billing cycle
Maintenance, utilities engineer
More water reused
STP output, RO reject, condensate and cooling blowdown are quantified, so recovery targets are set on real volumes
Sustainability, EHS
Benchmarked units
Plants and lines compared on intensity per litre or per tonne, so the efficient site becomes the standard rather than an anecdote
Operations leadership
Report ready records
Timestamped, line level water and energy records exportable for BRSR, GRI 303, CDP Water, ENERGY STAR and pollution board filings
Sustainability, compliance, company secretary
No new headcount
Alerts and agents do the watching. The team acts on a ranked list rather than reading trends
How much water does a dairy plant use per litre of milk?
Published benchmarks put dairy processing water use between 1 litre and more than 7 litres per litre of milk processed, with best in class liquid milk plants achieving 1 litre or less. Product mix drives the spread: cheese and powder lines consume far more than liquid milk, with figures such as 10 litres per kilogram for cheddar and above 25 litres per kilogram for some ultrafiltered products.
The honest answer for any specific plant is that it is unknowable until the intake and the major sub loops are metered. Most plants that assume they sit at 2 litres discover they are closer to 3 or 4 once unaccounted loss is separated out.
What percentage of a dairy plant's water goes to clean in place?
Clean in place accounts for close to 75 percent of total water consumption in dairy plants. In the United States, around half of the roughly 21 billion gallons used annually across 1,300 dairies goes to CIP.
CIP is also energy intensive, typically representing around 30 percent of plant energy consumption in some analyses and 10 to 26 percent in intercountry comparisons, driven by hot caustic and acid circulation and the cleaning of evaporators and dryers.
What share of dairy plant electricity is refrigeration?
Refrigeration typically accounts for 50 to 60 percent of total electrical consumption in a dairy processing plant. Separately, about 80 percent of a dairy's total energy consumption goes to generating steam and hot water, with the remaining 20 percent consumed as electricity across mechanical processes, refrigeration, ventilation and lighting.
That split matters when choosing where to start. If you meter electricity only, you are looking at the smaller half of the energy story and missing the boiler house entirely.
Does installing Aqueduct interrupt dairy production?
No. Instrumentation is non invasive by design. Clamp on ultrasonic flow meters fit to the outside of existing pipe, current transformers clip around existing conductors, and existing meters, PLCs and BMS points are read over BACnet, Modbus, MQTT, OPC UA or vendor APIs.
Where a line has to be broken for an inline meter, that work is scheduled into a planned shutdown. Nothing in the standard survey or commissioning process requires production to stop.
How long before a dairy plant sees its first finding?
First live data typically arrives between 2 and 6 weeks from the first call, depending on site size and connectivity. The first anomaly usually appears within days of that.
At a top 25 US airport campus, Aqueduct surfaced a 9,000 gallon per day anomaly within 72 hours of go live. Dairy plants tend to be faster, because the process is cyclical and a deviation from the previous cycle is easier to spot than a deviation from a flat baseline.
Can Aqueduct monitor bulk milk coolers and village chilling centres?
Yes. Chilling centres and bulk milk coolers are treated as sites in the same portfolio as the main plant, connected over cellular or LoRaWAN where fixed connectivity is unavailable.
What you get is compressor run hours, power draw, temperature profile and door or lid events per centre, ranked across the network, so a failing unit is visible from the plant before it becomes a quality rejection.
Does it work with our existing SCADA, BMS and meters?
Yes, and it is designed to. Aqueduct is hardware agnostic and supports more than 130 device types across any protocol. Existing instrumentation is consumed rather than displaced, and gaps are filled with retrofit sensors only where a measurement genuinely does not exist.
The value is rarely in new sensors alone. It is in normalising the ones you already have into a single model that reconciles.
What reporting frameworks does the data support?
Water and energy records are exported at line level with timestamps for BRSR and BRSR Core in India, GRI 303, CDP Water, ENERGY STAR plant benchmarking in the United States, state pollution control board returns, and internal ESG or water positive programmes.
Because the underlying data is continuous and metered rather than estimated, it stands up to reasonable assurance in a way that spreadsheet reconstruction does not.
What does a dairy deployment cost and what is the payback?
Cost depends on the number of measurement points, not on the size of the site in acres. A single unit lighthouse pilot is scoped from the site survey, and the survey itself is where the point count is agreed.
On payback, the pattern across deployments is that the first named loss in the first weeks of live data is usually larger than the annual cost of instrumenting the unit that found it. We scope pilots so that the before and after is measurable against your own 12 months of bills, rather than against a vendor model.
Which unit should we instrument first?
Pick the unit with the most complete utility story under one roof: heavy process water, CIP and wash down, a thermal load, and its own electrical feed. In multi product campuses that is usually beverages, liquid milk or ghee rather than dry milling.
Contained boundaries matter more than size. One supply, one discharge and one energy feed to reconcile makes the first balance clean, and a clean first balance is what makes the second unit an easy decision.
References
Sources for the figures on this page
Every benchmark quoted above is third party and linked below. Milvian figures (175+ facilities, 19 countries, 130+ device types, 2 to 6 weeks to live data, 88 facilities and 75,000 m3 saved, 5,000 meter points and the 9,000 gallon per day find) are our own deployment records.
Published benchmarks run from 1 to more than 7 litres of water per litre of milk processed. Here is what sits behind the spread, why most plants sit worse than they think, and how to find your real number.
Clean in place is the largest single consumer of water and one of the largest consumers of energy in a dairy. Almost all of it runs to a fixed timer. Measurement, not shorter cycles, is what makes it safe to reduce.
Refrigeration takes 50 to 60 percent of dairy plant electricity. A fouled condenser, a wrong suction pressure or an iced evaporator never trips an alarm, because the product stays cold. It just costs more every hour.
Around 80 percent of dairy energy goes to steam and hot water. Failed traps can lose 20 percent of it, distribution wastes 10 to 20 percent more, and unreturned condensate is paid for three times over.
Dairy effluent carries BOD of 500 to 3,500 mg per litre depending on the line. CPCB wants outlet BOD at or below 30. BRSR Core wants the water numbers assured. Both need continuous measurement, not a monthly grab sample.
A large dairy runs hundreds of chilling centres and bulk milk coolers on unreliable power, with no telemetry. The first sign of a failure is usually a rejected tanker, hours after the fact.
The physics of a dairy plant does not change between Wisconsin, Dubai Industrial City and Andhra Pradesh. What changes is what water costs, what cooling costs, and who is asking for the evidence.
8 min read
Next step
Start with one plant. Prove it in a quarter.
Pick your most utility intensive dairy unit. We will instrument it non invasively, reconcile its water and energy balance, and name the losses in your own numbers. Nothing binding.