One bill, no line items. That is the manufacturing utility problem.
Aqueduct meters water, electricity, steam, compressed air, cooling and effluent across every unit on a campus, reconciles them into balances that have to add up, and turns the largest unmanaged variable in the plant into a managed one.
On a large, unmetered manufacturing campus, up to 40 percent of water supply can sit as unaccounted loss, compressed air leaks routinely waste 20 to 40 percent of generated air, and failed steam traps can lose roughly 20 percent of the steam leaving the boiler. Aqueduct meters each utility non invasively, builds a balance that has to reconcile, and raises an alarm within about 60 seconds when it stops reconciling, rather than at the next billing cycle.
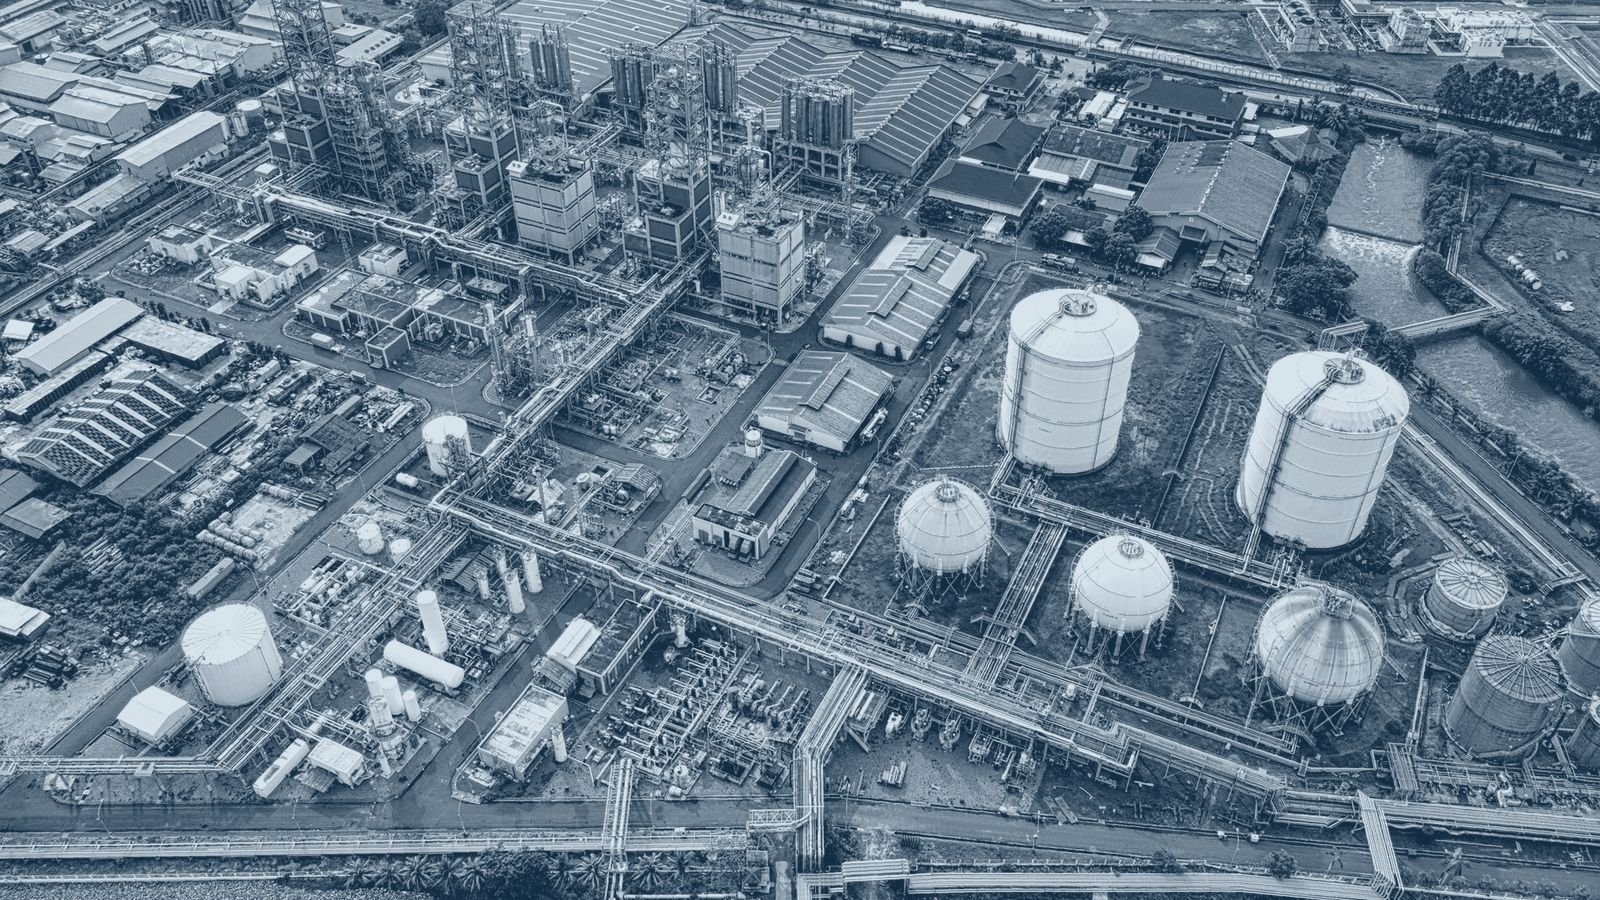
Milvian works with one of India's ten largest manufacturing campuses, roughly 500 contiguous acres running food, beverage, dairy and ghee, edible oil refining, herbal extraction, milling, personal care and packaging units side by side. Every unit metered its own bill. Nobody saw the campus as a single, comparable system. That gap is the same on a 500 acre park in Uttarakhand, a plant in Ohio and a factory in Dubai Industrial City.
You cannot manage what you can only see once a month
Manufacturing measures everything that touches the product. Yield, throughput, downtime, reject rate, moisture, weight, all to several decimal places, in real time, with an owner for each. Then the utilities that make production possible arrive as one number on a monthly bill, with no visibility into which line, which shift or which process spent it.
1number on the monthly bill, with zero line level attribution
~40%of supply can sit as unaccounted loss until a site is metered
60sis all it takes to spot a burst once the campus is live and telemetered
01
Unaccounted water loss, at campus scale
Leaks, tank overflows, idle draw and hoses left running accumulate quietly across a large site. Until a campus is metered, as much as 40 percent of supply can sit as unaccounted loss, and the term does not appear on any report because nobody is calculating a balance.
What it costsPaid at the intake, treated at the ETP, and counted against you in the disclosure. Three costs, one loss.
02
Compressed air, the most expensive utility per unit of work
Compressed air systems typically consume 10 to 30 percent of a plant's total electricity. Avoidable leaks frequently waste 20 to 40 percent of generated air, and in poorly maintained facilities losses can reach 50 percent of compressor capacity. A leak makes a noise that a factory floor swallows completely.
What it costsYou run a compressor continuously to pressurise the atmosphere through a hole nobody can hear.
03
Steam and condensate, lost three ways
Without a preventive maintenance programme, approximately 20 percent of steam leaving the boiler plant can be lost through leaking traps, distribution losses waste 10 to 20 percent more, and steam and condensate leaks can account for as much as 19 percent of overall plant energy consumption.
What it costsEvery litre of condensate not returned is paid for again in water, in chemicals and in fuel.
04
Power factor and peak demand, billed before anyone sees them
Feeder level load, power factor and demand spikes are invisible until the utility invoice arrives. By then the peak that set the demand charge happened weeks ago and cannot be investigated, let alone prevented.
What it costsA penalty charged monthly for a condition that could be corrected once.
05
Reuse that is claimed but not quantified
STP output, RO reject, cooling blowdown and boiler condensate are all recoverable, and all are commonly reported as reuse without a meter behind the number. RO recovery typically runs 50 to 75 percent, which means a quarter to half the feed leaves as reject, usually to drain.
What it costsAn unverifiable reuse figure fails at the first assurance question and wastes the recoverable volume in the meantime.
06
No comparability between units
On a multi unit campus the highest value question is which unit is efficient and which is not, normalised per tonne or per litre of output. Without sub metering, a small intense plant hides comfortably behind a large one and the efficient unit gets no credit.
What it costsCapital goes to the loudest unit rather than the one with the worst intensity.
Every utility, mapped
Nine utility systems, and what each one hides
Manufacturing campus utility map
Utility
Where it goes
The usual failure
What Aqueduct meters
Process and service water
Product make up, washing, cooling, general service
Up to 40 percent unaccounted loss before metering
Intake by source, per unit and per line flow, with unaccounted loss as an explicit balance term
Electricity distribution
Incomers, transformers, feeders, motor control centres
Power factor penalties and demand peaks discovered on the invoice
Feeder level load, power factor, peak demand, transformer and distribution loss estimates
Steam and boiler fuel
Process heating, drying, evaporation, cleaning
Around 20 percent lost to failed traps, condensate not returned, blowdown unmanaged
Conditions assumed rather than logged, ventilation on fixed schedules
CO2, PM2.5, VOC, temperature and humidity per zone against ventilation energy
Ranges are indicative and drawn from the published sources listed at the foot of this page. A site survey replaces them with your measured numbers.
Coverage matters more than individual meter accuracy. An uncovered flow is indistinguishable from loss.
Three markets, three clocks
What is forcing the issue in the USA, Dubai and India
United States
Cost, competitiveness programmes and customer driven disclosure.
Water is repricing
US water and sewer bills rose roughly 24 percent over five years with further increases filed for 2026. Non revenue water sits near 16 percent nationally and utilities recover it through rates, which industrial users pay.
The efficiency programme is national
DOE Better Plants partners have saved billions in energy costs, and the programme has extended into industrial water savings. Participation depends on measured plant level data.
The standard is measurement led
ISO 50001 and DOE assessment methodologies both rest on sub metered energy performance indicators rather than site totals.
Where Aqueduct lands
Multi plant manufacturers who need comparable intensity per plant and per line without a multi year corporate data programme.
Dubai and the UAE
A cooling dominated grid, manufactured water, and mandated demand reduction.
Cooling dominates the bill
Up to 80 percent of a building's electricity demand in the UAE goes to cooling. In a factory, process cooling and HVAC together usually exceed every other electrical load combined.
Water carries embedded energy
Industrial water in the Gulf is desalinated or heavily treated. Industrial demand at sites such as Dubai Industrial City is projected to grow 7 to 9 percent annually through 2030.
The targets are explicit
Dubai's Demand Side Management strategy targets a 30 percent reduction in electricity and water demand by 2030 against business as usual, and Dubai Industrial Strategy 2030 explicitly promotes energy efficient manufacturing. UAE Net Zero 2050 turns plant efficiency into reported obligation.
Where Aqueduct lands
Manufacturers who have to evidence consumption per asset rather than estimate it, and who need cooling allocated by zone and by process.
India
Assured disclosure, pollution board enforcement and a live carbon market.
BRSR Core is assured
BRSR Core disclosures carry reasonable assurance from an independent provider under ISAE 3000 or ISAE 3410, covering energy consumption, emission intensity and water metrics for listed entities.
CCTS is live
The Carbon Credit Trading Scheme, notified in June 2023, is absorbing the PAT mechanism. Roughly 490 entities across seven sectors carry active compliance obligations for FY 2025 to 26 and FY 2026 to 27, with the first compliance date for FY 2025 to 26 falling on 31 July 2026.
The boards are watching in real time
CPCB general standards require outlet BOD at or below 30 mg per litre for inland surface discharge, and state boards now operate real time monitoring with strengthened enforcement powers. ZLD is mandated for certain high load sectors.
Where Aqueduct lands
Large multi unit campuses that need one measurement standard feeding the environmental filing, the annual report and the carbon obligation from a single source.
The solution
Aqueduct: one live layer over the campus you already run
Aqueduct is hardware agnostic by design. Any sensors, any protocols, any controls. It consumes the infrastructure that is already specified rather than displacing it, reading BACnet, Modbus, MQTT, OPC UA and vendor APIs into a single normalised asset model, and adds retrofit sensors only where a measurement genuinely does not exist.
Water
aQ WaterGuard
A live schematic that has to balance.
Supply equals process plus utilities plus RO feed plus fire plus unaccounted loss, reconciled every 60 seconds
When the equation stops reconciling, the loss term rises and you know before the bill does
Every unit ranked by total, intensity and per unit of output, so a small intense plant cannot hide behind a big one
Reuse quantified line by line: STP, RO reject, condensate and cooling blowdown
Missing data flags, so an un instrumented unit is obvious on day one
Energy
aQ EnergySmart
The same lens turned on power, heat and air.
Feeder level load and power factor, so the PF penalty and demand spike are visible before the utility bills them
Solar offset and carbon tracked live against grid import for the ESG ledger
Transformer and distribution losses estimated end to end
Boiler fuel, steam flow and condensate return as one thermal balance
Smart controls on pumps, VFDs, RTUs and AHUs, each reporting health, estimated savings and comfort
Air
aQ AirSafe
Environmental conditions where people actually work.
Continuous CO2, PM2.5, VOC, temperature and humidity per zone
Ventilation tied to occupancy and process need rather than to a fixed schedule
Compliance and wellbeing evidence reported automatically
Intelligence
aQ Core
Agentic AI, not another dashboard.
Agents detect drift, diagnose cause, rank interventions by payback and issue the work order into CAFM, CMMS or ERP
Live waste event scanning across every site, flagging leaks and overflows without anyone logging in
Plain English answers over the whole estate, with the underlying series behind every number
Audit grade export for BRSR, GRI 303, CDP Water, ISO 50001 and pollution board reporting
Agents rank interventions by payback and issue the work order into your CMMS.
Deployment
Start with one unit. Prove it in a quarter. Then scale in waves.
Not 500 acres on day one. One self contained, high intensity unit with a complete water and thermal story, instrumented end to end as a lighthouse the whole campus can see. Contained boundaries matter more than size: one supply, one discharge and one energy feed makes the first balance clean, and a clean first balance is what makes the second unit an easy decision.
Day 0
Site survey
Walk the pilot unit. Map meters, panels, taps, air lines, boilers, cooling and reuse loops. Wireless survey for gateway coverage. Pull 12 months of bills. Non invasive, and production never stops.
Week 2
Instrumentation plan
Sensor list, gateway layout and the water and energy balance model for your sign off.
Week 3 to 8
Phased metering
Non intrusive flow, pressure, level and power sensors fitted. Data starts flowing zone by zone.
Day 90
Live and first savings
Digital twin live and reconciling. First leaks and losses named, quantified against the baseline.
Then scale in waves
Phase
Scope
What it delivers
Quarter 1
Lighthouse unit
One unit live end to end. Water digital twin, energy feeders, first verified savings.
Quarters 2 to 3
Expand
The next highest intensity units join. Smart controls automate the largest loads.
Quarter 4
One campus view
Every unit on one portfolio, ranked, benchmarked and reporting ready across the whole site.
One self contained unit with a complete water and thermal story, instrumented end to end.
Proof
Where this has already run
Manufacturing, India
One of India's ten largest manufacturing campuses
Roughly 500 contiguous acres running food and beverage, dairy and ghee, edible oil refining, herbal and ayurveda extraction, flour and spice milling, personal care and packaging, plus boilers, cooling, STP and RO. Each unit metered its own bill and nobody saw the campus as one comparable system.
Focus: campus water balance, per unit benchmarking, reuse quantification, disclosure grade records
Dairy, Andhra Pradesh
One of the state's largest dairy operations
Process water, CIP circuits, refrigeration load and boiler thermal balance instrumented as one system rather than four separate departments.
Focus: CIP volume per cycle, refrigeration efficiency, condensate recovery
Dairy and ghee, North India
A large Uttar Pradesh belt dairy and ghee operation
Ghee and butter lines carry the heaviest fat and effluent load in food processing. Metering the wash down and cleaning volumes behind that load turned an effluent problem into a measured process variable.
Focus: wash down volume, effluent shock load attribution
Global water stewardship
A Fortune 1 water positive programme
One real time water intelligence layer across the portfolio in support of a public water positive commitment, with same day leak and anomaly detection and auditable data for reduce, reuse and replenish reporting.
88 facilities monitored, 75,000 m3 of water saved
Aviation, United States
A top 25 US airport, live in 72 hours
Roughly 5,000 meter points instrumented across a 24/7 campus. A 9,000 gallon per day anomaly surfaced within 72 hours of go live, a find manual reads would have missed for months.
5,000 meter points, 72 hours to first find
The platform record
175 plus facilities, 19 countries
Hardware agnostic across 130 plus device types and any protocol. Enterprise grade and AWS native, as an AWS Advanced Tier Services Partner, with role based access and audit logging.
2 to 6 weeks from first call to live data
Client names are withheld where usage permission is still in progress. Reference calls can be arranged under NDA.
Outcomes
What a live campus delivers
Lower utility bills
Leaks, idle draw, air losses and power factor penalties become named line items with an owner and a payback, rather than an unexplained variance.
More water reused
STP output, RO reject, condensate and cooling blowdown quantified, so recovery targets are set against real volumes rather than design assumptions.
Fewer surprises
Bursts, overflows and demand spikes caught in about 60 seconds rather than next month, which changes both the cost and the response.
Benchmarked units
Plants compared on intensity per tonne or per litre, so the efficient unit is rewarded and capital goes where the intensity is worst.
Report ready data
Audit grade water and energy records for BRSR, GRI 303, CDP Water, ISO 50001, DOE programmes and pollution board disclosures, from one source of truth.
No new headcount
Automation and agents do the watching. The team acts on a ranked list of what matters instead of reading trends.
How much water does a manufacturing plant typically lose?
On a large campus that has not been metered, as much as 40 percent of supply can sit as unaccounted loss across leaks, tank overflows, idle draw and equipment left running. The figure is an indicative range from comparable multi plant deployments rather than a universal constant.
The point is not the number itself. It is that the loss term is not calculated at all in most plants, so whatever the real figure is, nobody knows it and nobody is chasing it.
How much energy do compressed air leaks waste?
Compressed air systems typically consume 10 to 30 percent of a plant's total electricity, and avoidable leaks frequently waste 20 to 40 percent of the air generated. In well maintained systems leakage should be below 10 percent, while poorly maintained systems can lose 20 to 30 percent of air capacity and power, and untreated facilities can reach as high as 50 percent of compressor production capacity.
The most reliable detection method is off shift baseline demand. Any air being consumed when no production is running is leaking.
What is a utility digital twin and how is it different from a dashboard?
A dashboard displays readings. A digital twin models the plant as a system of relationships that must hold: supply equals the sum of consumption plus unaccounted loss, boiler output equals steam delivered plus losses, and so on.
The difference matters operationally. A dashboard requires someone to notice a number is wrong. A twin fails to reconcile, which is an event in itself, and covers loss modes nobody thought to write a threshold for.
Will installation interrupt production?
No. Instrumentation is non invasive by design: clamp on ultrasonic flow meters, current transformers, surface temperature sensors and existing meter and PLC integration over standard industrial protocols.
Any work requiring a line break, such as an inline meter where clamp on measurement is not viable, is scheduled into a planned shutdown. The survey itself never interrupts production.
How does it work with our existing SCADA, BMS and ERP?
Aqueduct is hardware agnostic and supports more than 130 device types across any protocol, reading BACnet, Modbus, MQTT, OPC UA and vendor APIs into one normalised asset model. Existing instrumentation is consumed rather than displaced.
On the output side, agents can issue work orders into CAFM, CMMS and ERP systems, so a detected fault becomes a scheduled job rather than an alert someone has to read and re enter.
How quickly is the first finding delivered?
First live data typically lands 2 to 6 weeks from the first call. Anomalies usually follow within days of that. At a top 25 US airport campus, Aqueduct surfaced a 9,000 gallon per day anomaly within 72 hours of go live.
A defensible before and after against 12 months of historic bills takes about a quarter, because it needs to cover a representative production cycle.
Which unit should we instrument first on a multi unit campus?
The one with the most complete utility story under one roof: heavy process water, cleaning and wash down, a thermal load, and its own electrical feed, with clear physical boundaries.
Contained boundaries matter more than size. One supply, one discharge and one energy feed makes the first balance clean, and a clean first balance is what earns the second unit.
What reporting frameworks does this support?
Water and energy records are exported at line level with timestamps for BRSR and BRSR Core in India, GRI 303, CDP Water, ISO 50001 energy performance indicators, DOE Better Plants reporting in the United States, state pollution control board returns, and internal ESG or water positive programmes.
Because the underlying data is continuous and metered, it stands up to reasonable assurance in a way that reconstructed spreadsheet allocation does not.
Is the platform secure enough for an industrial network?
Aqueduct is enterprise grade and AWS native, built as an AWS Advanced Tier Services Partner, with SOC 2 aligned security, role based access control and audit logging.
Architecturally it is designed to sit on the monitoring side rather than in the control path, and where OT connectivity is required it uses secure, segmented access into plant networks.
References
Sources for the figures on this page
Third party benchmarks are linked below. Milvian figures (175+ facilities, 19 countries, 130+ device types, 2 to 6 weeks to live data, 88 facilities and 75,000 m3 saved, 5,000 meter points and the 9,000 gallon per day find) are our own deployment records.
Seven research notes on where a manufacturing campus loses water, power and heat, what the reporting regimes in India, the United States and the Gulf now require, and how a utility digital twin makes losses self evident.
Until a large campus is metered, as much as 40 percent of supply can sit as unaccounted loss. The number is not the point. The point is that almost nobody calculates the term at all.
Compressed air is 10 to 30 percent of plant electricity and leaks waste 20 to 40 percent of it. Failed steam traps can lose 20 percent of boiler output. Neither failure ever trips anything.
Two of the largest components of an industrial electricity bill are decided by conditions that last minutes and are invisible for weeks. Feeder level metering is what makes them manageable.
RO recovery typically runs 50 to 75 percent, which means a quarter to a half of the feed leaves as reject. Cooling blowdown is recoverable at 75 to 90 percent. Most of it goes to drain because nobody meters it.
BRSR Core disclosures carry independent reasonable assurance. CCTS is absorbing PAT with compliance obligations already live. Both run on the same underlying measurement, and most plants maintain three versions of it.
Threshold alarms catch the failure someone anticipated. A balance catches every failure that changes the total, including the ones nobody thought to write a rule for.
A multinational manufacturer runs one process and three reporting regimes. The engineering is identical everywhere. The evidence each market demands is not.
8 min read
Next step
Not the whole campus. One unit, one quarter.
Pick a self contained, high intensity unit with a complete water and thermal story. We instrument it end to end as a lighthouse the rest of the site can see, and the numbers are yours either way.