The Compounding Cost of Undetected Leaks

A 1/8" supply line crack at 60 PSI leaks approximately 940 gallons per day that's 28,200 gallons before your next monthly read. At commercial water rates, that's $150+ in water alone.

But the real cost is structural: water damage averages $340K per incident in commercial properties. Mold remediation adds $15K–$30K. Business interruption can multiply total losses 5–10×. Every hour of detection delay compounds the damage exponentially.

WHY SPEED MATTERS

The Leak Detection Timeline: Hours vs. Months

Every hour a leak goes undetected, damage compounds. Here's how detection speed changes the outcome.

<15 min

Aqueduct alerts. Flow anomaly detected. Automated shutoff triggered.

1–4 hrs

Maintenance dispatched. Damage limited to source area. Cost: $500–$2K.

24–72 hrs

Water spreads to adjacent spaces. Drywall, flooring compromised. Cost: $15K–$50K.

1–2 weeks

Mold begins. Structural damage. Tenant displacement. Cost: $75K–$200K.

30+ days

Next billing cycle reveals anomaly. Full remediation required. Cost: $340K+ avg.

Compounding Risk

A 1/8" supply line crack at 60 PSI leaks ~940 gallons/day. Business interruption can multiply total losses 5–10×.

INDUSTRY CHALLENGES

What Your Water Infrastructure Can't Tell You Yet

Monthly meter reads create 30-day blind spots. Aqueduct fills every gap with continuous, intelligent monitoring.

Silent Water Catastrophes

A stuck irrigation valve runs 24/7. A cooling tower leak drains 200 gallons/hour. 
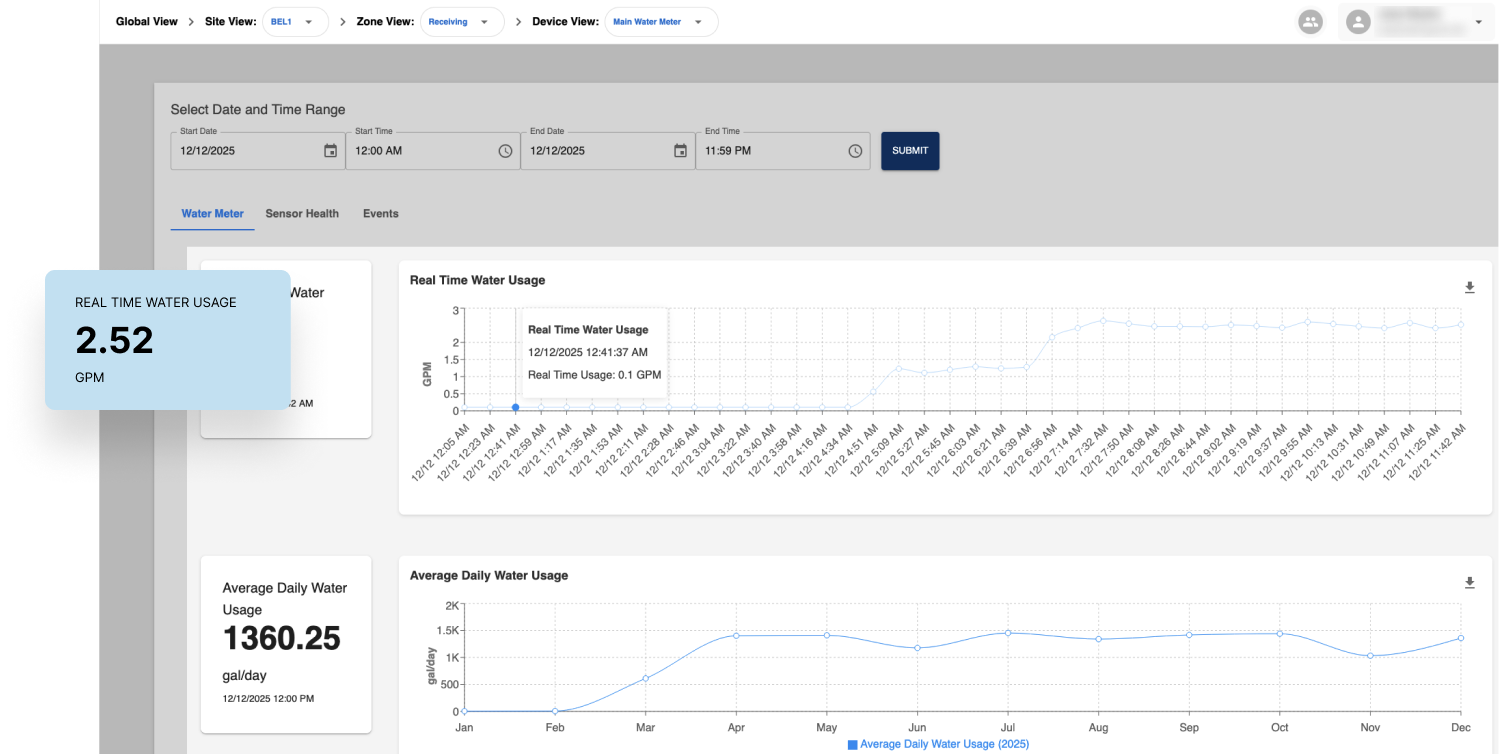
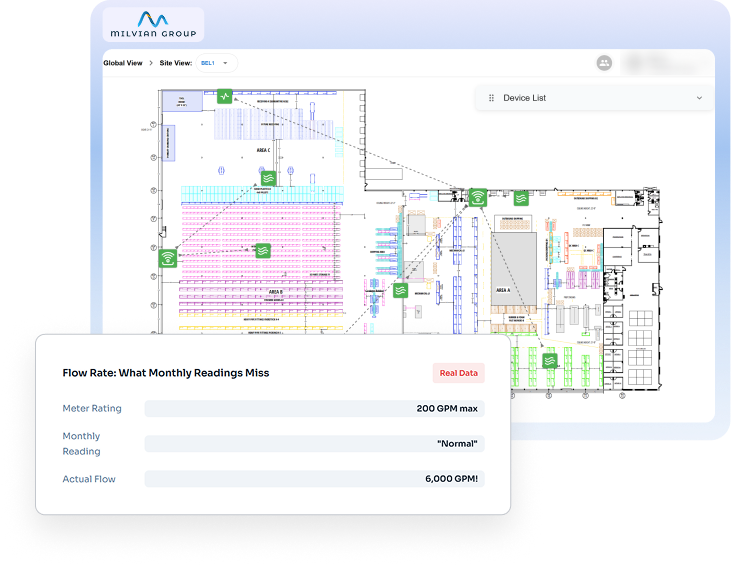
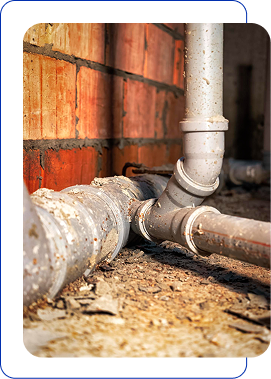
A toilet supply line fails Friday night. You find out on Monday or worse, the next billing cycle. By then, the damage has compounded beyond simple repair.

$340K average water damage incident

Billing Cycle Blind Spots

Monthly meter reads average consumption across 30 days. A 3-day burst event gets diluted into a slightly higher number. Slow leaks that waste 50–100 gallons/day never trigger alerts. The meter counts total volume it can't tell you when, where, or why.

30+ days typical leak detection time

Reactive Maintenance Spiral

Without continuous monitoring, every water issue becomes an emergency. Pipe deformation goes unnoticed. Joint fatigue compounds. Pressure irregularities stress connections. By the time it's visible, the repair costs 3–5× what planned maintenance would have cost.

3–5× emergency vs. planned repair cost

THE AQUEDUCT APPROACH

Water Leak Detection:
Catch It in Hours, Not Months

From silent drips to catastrophic bursts, Aqueduct detects every anomaly and can trigger automated shutoffs before damage spreads.

monitoring
15-Minute Interval Flow Monitoring

Continuous flow measurement captures burst events, slow leaks, and usage anomalies invisible to monthly reads.

anomaly
Pattern-Based Anomaly Detection

AI learns baseline consumption patterns per zone and time-of-day. Detects deviations from behavior not just static thresholds.

retrofit
Non-Invasive Retrofit Sensors

No pipe modifications. No meter replacements. Clamp-on ultrasonic and retrofit pulse sensors install in hours with zero disruption.

lorawan
Automated Shutoff Integration

When critical thresholds are breached, Aqueduct triggers automated valve shutoffs stopping damage while you're still being notified.

Aqueduct Platform

Unified Infrastructure Intelligence

Aqueduct Platform Flow
Flow Sensors
LoRaWAN
AI Detection
Alert & Shutoff
Flow Sensors
LoRaWAN
AI Detection
Alert & Shutoff

<15 min

Leak detection time

14%

Avg. water cost reduction

$340K

Avg. damage prevented per incident

99.5%

Sensor uptime reliability

PLATFORM CAPABILITIES

One Platform. Complete Water Visibility.

Flow rates, pressure, leak detection, bill verification, and automated protection unified in a single dashboard with AI-powered insights.

Flow Intelligence

Know exactly where every gallon goes
  • Real-time GPM monitoring
  • Zone-level sub-metering
  • Usage pattern analysis
  • Bill verification & audit

14% avg. water reduction

Leak Detection

Catch leaks in minutes, not billing cycles
  • Continuous flow anomaly monitoring
  • Nighttime minimum flow alerts
  • Burst detection & classification
  • Slow leak trend identification

<15 min detection

Automated Protection

Stop damage before it starts
  • Motorized valve shutoff integration
  • Zone isolation automation
  • Escalation notification chains
  • After-hours auto-protection

$340K avg. damage prevented

Pressure Monitoring

See the forces stressing your pipes
  • Continuous PSI tracking
  • Water hammer detection
  • Pressure drop correlation
  • PRV performance validation

Real-time pressure tracking

Predictive Maintenance

Fix it before it fails
  • Joint stress pattern analysis
  • Pipe deformation indicators
  • Connection fatigue scoring
  • Replacement priority ranking

Predictive alerting

AI & Analytics

Turn data into water savings
  • Natural language queries (GenAI)
  • Automated consumption reports
  • Seasonal pattern recognition
  • Conservation opportunity scoring

10x faster insights

Meter Validation

Trust your numbers or find out why you shouldn't
  • Pulse meter accuracy verification
  • Over-specification detection
  • Meter saturation alerting
  • Billing discrepancy flagging

30× over-spec detected

Digital Twins

Your water system in digital form
  • Facility → zone → fixture drill-down
  • Pipe network visualization
  • Real-time flow overlays
  • Leak location estimation

40% faster troubleshooting

Industry Insight: When Meters Lie The Saturation Problem
Pulse meters have a maximum counting speed. When water flows faster than rated capacity, they saturate they can't count pulses fast enough, resulting in systematic undercounting. Your bill looks normal while infrastructure operates catastrophically beyond safe parameters. At a major U.S. airport, Aqueduct discovered pipes flowing at 1,200–6,000 GPM through meters rated for 200 GPM 6–30× over specification. Monthly readings showed "normal." The pipes had audible knocking, visible deformation, and active leaks at joints. This isn't an edge case it's a systemic blind spot in facilities relying on monthly meter reads.

✓ Verified Pilot Results

From 30-Day Blind Spots to Real-Time Water Visibility

How Aqueduct detected critical water infrastructure failures at a luxury hotel resort within days issues that monthly readings would have missed for months.

Luxury Hotel Infrastructure
Water Monitoring Sensors

Luxury Hotel & Resort Property

350+ Rooms • Multi-Building Campus • Pool & Spa Complex

06

Meters Instrumented

<3

Days to First Alert

03

Critical Leaks Found

0

Operational Disruption

01

The Challenge

A luxury resort experiencing steadily rising water bills with no explanation. Multiple buildings, pools, irrigation systems, and laundry facilities made manual tracking impossible. Monthly meter reads showed total consumption but couldn't pinpoint which systems were responsible. Previous attempts at manual leak hunts found nothing.

02

What We Found

Critical Finding #1

Underground Irrigation Leak

Irrigation zone 3 was consuming water 24/7 despite a 45-minute daily schedule. A cracked supply line was leaking 180 gallons/hour undergroundinvisible to visual inspection and active for an estimated 3+ months before detection.

388,800 gallons wasted

Over 3 months at 180 gallons/hour invisible until Aqueduct detected 24/7 flow

Critical Finding #2

Nighttime Anomaly Guest Wing B

Between 2–5 AM, Guest Wing B consistently consumed 4x the expected flow rate. Investigation revealed a "toilet cascade"three units with faulty flapper valves each losing 200 gallons/day, masked as "normal" consumption in utility reads.

$23K / year wasted

18,000+ gallons/month from 3 faulty flappers $3 parts each

Critical Finding #3

Pool Complex Makeup Water Anomaly

The pool system was consuming 2.5x expected makeup water. Aqueduct’s flow pattern analysis pinpointed consumption spikes correlated with the circulation pump cycle, identifying a leak in the return line below the pool deck.

$180K+ damage prevented

Subsurface pool return leak caught before deck structural compromise

Bonus Finding: Bill Verification

Utility Meter Accuracy Discrepancy

Cross-referencing Aqueduct sub-meter data against the utility's main meter revealed a 12% discrepancy where the utility meter was overcounting. This allowed the resort to file for a formal billing adjustment.

$8,400 recovered

12 months of utility overcharges identified and reclaimed

03

The Solution

Non-invasive retrofit pulse sensors on 6 water meters covering main buildings, pool complex, irrigation, and laundry. LoRaWAN connectivity across the campus. 15-minute interval monitoring with AI-powered anomaly detection. Automated shutoff valves on two critical supply lines.

04

Proven Results

<3 Days

Time to first alert

3 Critical

Leaks detected

$247K

Damage prevented + savings

6 Months

Full ROI payback

0

Operational disruption

Every Gallon Has a Story. Start Listening.

  • Personalized to your portfolio
  • Live platform walkthrough
  • ROI projection included

Schedule a personalized demo to see Aqueduct detect leaks in minutes, verify meter accuracy, and protect your infrastructure from water damage.