The Hidden Cost of Poor Indoor Air Quality

The average person spends 90% of their time indoors. Indoor pollutant concentrations can be 2–5× higher than outdoor levels. Yet most buildings monitor air quality quarterly at best or only when occupants complain.

Research from Harvard's T.H. Chan School shows that improved ventilation and IAQ correlates with 8–11% productivity gains and 35% fewer sick building syndrome symptoms. For a 500-person office, that translates to $3.5M+ in annual productivity value. The buildings that measure it, manage it and attract the tenants willing to pay premium rents for it.

INDUSTRY CHALLENGES

What Your Building Environment Can't Tell You Yet

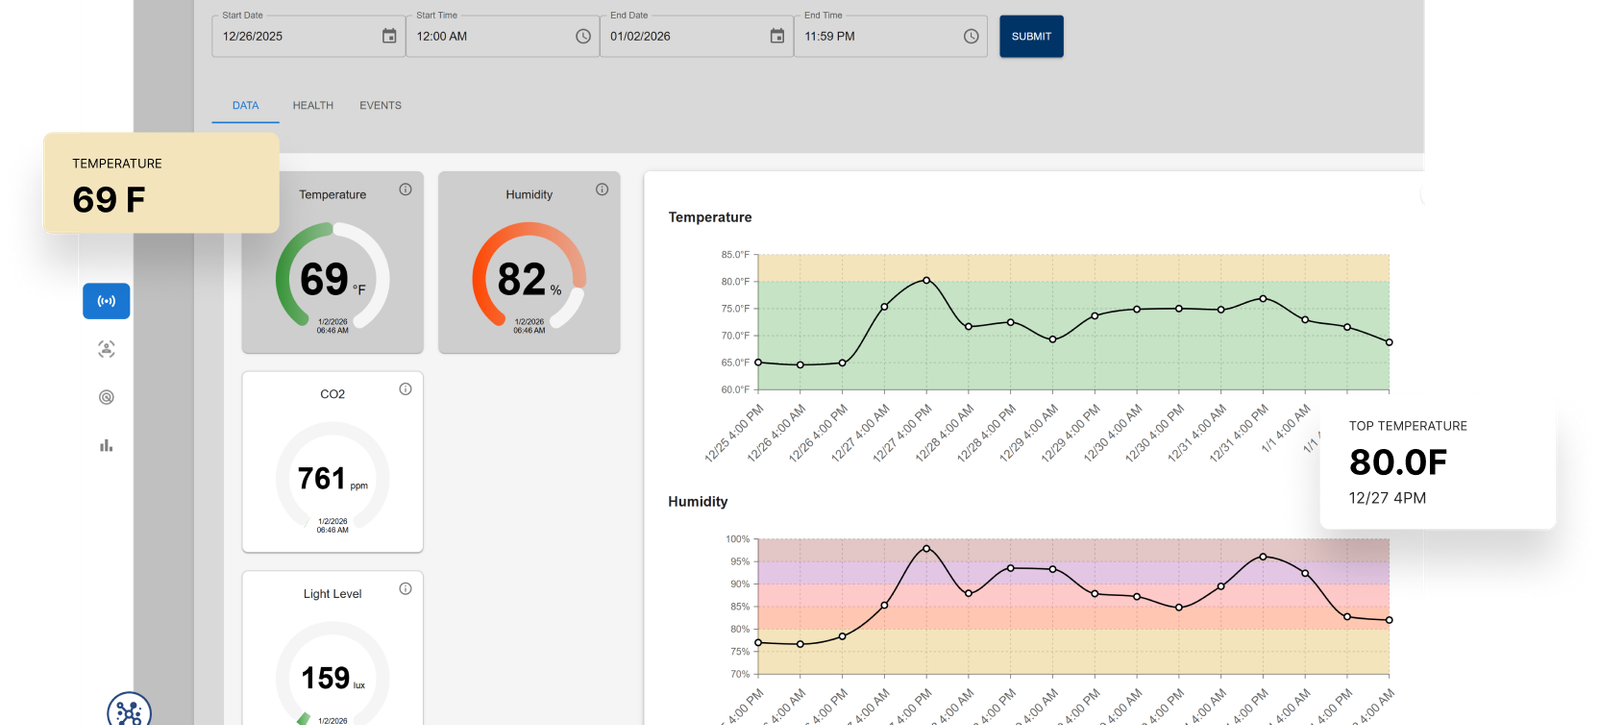
Quarterly spot-checks and complaint-driven responses leave occupants exposed and compliance at risk. Aqueduct makes the invisible visible.

Compliance Gaps You Can't See

OSHA, EPA, WELL, LEED, and local regulations require specific air quality thresholds but quarterly spot-checks capture a single moment in time. COâ‚‚ may spike for 3 hours daily in conference rooms. VOCs may exceed limits every afternoon. Your compliance report shows the one hour it was measured, not the 8,759 hours it wasn't.

$7.5K avg. OSHA violation fine (up to $161K)

Sick Building Syndrome

Headaches. Fatigue. Difficulty concentrating. 30% of commercial buildings have significant IAQ issues. Occupants feel the effects but can't articulate the cause. COâ‚‚ above 1,000 ppm reduces cognitive function by 15%. Above 1,500 ppm, decision-making drops 50%. Your HVAC system doesn't know the difference.

$3.5M+ annual productivity impact (500-person office)

Silent Safety Hazards

Gas leaks start small a loose fitting, a degraded seal, a valve that doesn't close completely. By the time it's detectable by smell, concentrations may already be in the danger zone. Refrigerant leaks waste thousands in operating costs while degrading air quality. Without continuous monitoring, the first alert is often the emergency.

70% of gas leaks go undetected for 24+ hours

THE AQUEDUCT APPROACH

Environmental Observability:
Protect, Prove, Optimize

Continuous multi-parameter monitoring that protects occupant health, ensures regulatory compliance, and provides the data to prove both.

monitoring
Multi-Parameter Sensing

COâ‚‚, VOCs, PM2.5, PM10, temperature, humidity, CO, NOâ‚‚, formaldehyde, and radon all from a single sensor platform per zone.

anomaly
AI-Driven Ventilation Recommendations

Algorithms correlate occupancy patterns, outdoor conditions, and indoor readings to recommend real-time ventilation adjustments.

retrofit
Automated Compliance Documentation

Continuous data logging with automated report generation for WELL, LEED, OSHA, EPA, and local regulatory requirements.

lorawan
Real-Time Alerting & Escalation

Tiered alert system from advisory notifications to emergency escalations. Gas leak detection triggers immediate safety protocols.

Aqueduct Platform

Unified Infrastructure Intelligence

Aqueduct Platform Flow
Env Sensors
LoRaWAN
AI Analysis
Comply & Act
Env Sensors
LoRaWAN
AI Analysis
Comply & Act

22%

Avg. IAQ improvement

100%

Compliance documentation rate

35%

Reduction in SBS symptoms

8–11%

Productivity gain correlation

COMPLIANCE FRAMEWORKS SUPPORTED

One Platform. Every Standard. Always Audit-Ready.

Aqueduct continuously monitors against the thresholds and documentation requirements of major compliance frameworks so you're never scrambling before an audit.

WELL Building Standard

Continuous air quality monitoring, thermal comfort, and humidity tracking aligned with WELL v2 Air, Thermal Comfort, and Sound concepts.

LEED Certification

Indoor Environmental Quality (IEQ) credits supported with continuous COâ‚‚, VOC, and PM monitoring and automated documentation.

OSHA Compliance

Permissible Exposure Limits (PEL) monitoring for workplace air quality, gas detection, and automated compliance record-keeping.

EPA Standards

NAAQS alignment, radon monitoring, and air quality index tracking with automated exceedance notifications and remediation logging.

ESG Reporting

Scope 1 and 2 emissions data collection, energy and water consumption tracking, and automated ESG metric generation for annual reporting.

Healthcare & ASHRAE

ASHRAE 62.1 ventilation rate monitoring, differential pressure tracking for sensitive spaces, and infection control air quality parameters.

PLATFORM CAPABILITIES

One Platform. Complete Environmental Visibility.

Air quality, gas safety, thermal comfort, and compliance unified in a single dashboard with AI-powered insights and automated controls.

Indoor Air Quality

Healthier spaces, happier occupants
  • COâ‚‚, VOC, PM2.5/10 monitoring
  • Temperature & humidity
  • AI ventilation recommendations
  • Zone-level granularity

22% IAQ improvement avg.

Gas Monitoring

Safety and efficiency in every BTU
  • Continuous leak detection (CHâ‚„, CO)
  • Pressure drop monitoring
  • Emergency notifications
  • Compliance documentation

100% safety compliance

Compliance Engine

Always audit-ready, zero manual effort
  • WELL / LEED / OSHA mapping
  • Threshold monitoring & alerting
  • Automated audit report generation
  • Exceedance logging & remediation

100% documentation rate

Sustainability Analytics

From data collection to disclosure
  • Scope 1 & 2 emissions tracking
  • Energy & water reduction metrics
  • Carbon intensity benchmarking
  • Automated ESG report generation

ESG-ready data

Controls & Automation

Close the loop automatically
  • Demand-controlled ventilation
  • BACnet/Modbus HVAC integration
  • AI-driven setpoints
  • Emergency ventilation protocols

24/7 automated optimization

AI & Analytics

Turn environmental data into action
  • Natural language queries (GenAI)
  • Automated trend reports
  • Anomaly pattern recognition
  • Predictive exceedance alerting

10x faster insights

Industry Insight: The COâ‚‚ Cognition Cliff
Research from Harvard and SUNY demonstrates a stark relationship between COâ‚‚ levels and cognitive performance. At 1,000 ppm (common in poorly ventilated offices post-lunch), cognitive scores drop 15%. At 1,500 ppm, decision-making performance drops 50%. Most conference rooms exceed 1,500 ppm within 45 minutes of a 6-person meeting. Yet without continuous monitoring, facilities teams have no idea this is happening. The cost isn't just discomfort it's measurable productivity loss. One Aqueduct client discovered their main conference center spent 4+ hours daily above 1,200 ppm, correlating with a measurable drop in post-meeting task completion rates.

✓ Verified Pilot Results

From Quarterly Spot-Checks to Continuous Environmental Intelligence

How Aqueduct transformed a healthcare campus from reactive IAQ management to proactive environmental control achieving WELL certification and eliminating compliance gaps.

Healthcare Campus Infrastructure
Environmental Monitoring

Regional Healthcare Campus

3 Buildings • 420 Beds • Lab, Pharmacy & Surgical Suites

48

Zones Monitored

<7

Days to Insights

05

Critical Issues Found

0

Operational Disruption

01

The Challenge

A regional healthcare campus pursuing WELL certification while struggling with inconsistent IAQ across buildings. Quarterly spot-checks showed compliance at the moment of testing, but staff complaints about air quality persisted. Differential pressure in surgical suites and pharmacy clean rooms required continuous verification but was only checked weekly. Gas monitoring relied on fixed-point detectors with no analytics layer.

02

What We Found

Critical Finding #1

COâ‚‚ Exceedances Waiting Areas

Three main waiting areas exceeded 1,200 ppm COâ‚‚ for an average of 5.2 hours daily, correlating with peak patient volume. The HVAC system failed to increase fresh air intake based on occupancy, a gap missed by quarterly 7 AM spot-checks.

5.2 hrs/day above safe levels

Invisible to quarterly testing affecting 400+ patients and visitors daily.

Critical Finding #2

Surgical Suite Pressure Reversal

OR-3 experienced intermittent positive-to-negative pressure reversals lasting 15–45 minutes when adjacent AHUs cycled. These contamination risk windows occurred 3x weekly and were never caught by manual weekly checks.

3x weekly contamination risk

Pressure reversals occurred between scheduled verification times.

Critical Finding #3

VOC Spike New Wing Off-Gassing

The renovated east wing showed VOC levels 3x above WELL thresholds for 8+ hours daily due to new flooring and furniture. Zone-level monitoring pinpointed the source of staff headaches and fatigue that manual checks couldn't identify.

3x above WELL threshold

8+ hours daily in renovated areas correlating with 47% of staff complaints.

Critical Finding #4

Gas Leak Kitchen Exhaust

A slow natural gas leak was detected within 6 hours of deployment. While below alarm thresholds, Aqueduct identified a steady upward trend caused by a degraded flex connector weeks before it reached actionable danger levels.

Early detection weeks before danger

Slow leak caught at trace levels before reaching emergency thresholds.

Outcome: WELL Certification Achieved

Continuous Data Enabled Full WELL Certification

With 90 days of continuous IAQ data across all 48 zones, the campus achieved WELL v2 Gold certification the first healthcare facility in the region to do so. The automated compliance engine generated all required documentation, eliminating 120+ hours of manual audit preparation. Ongoing monitoring ensures continuous compliance rather than point-in-time snapshots.

WELL Gold Certified

First healthcare campus in region supported by 90 days of continuous data

03

The Solution

48 multi-parameter environmental sensors deployed across patient rooms, surgical suites, pharmacy, waiting areas, and staff spaces. Continuous COâ‚‚, VOC, PM2.5, temperature, humidity, and differential pressure monitoring. LoRaWAN connectivity throughout the campus. AI-powered anomaly detection with automated HVAC integration for real-time adjustments.

04

Proven Results

<7 Days

Time to actionable environmental insights

5 Critical

Safety and compliance issues detected

WELL Gold

Certification achieved through continuous data

120+ hrs

Annual compliance audit prep eliminated

35% Fewer

Staff health and IAQ-related complaints

Your Building Has an Environment Story. Start Measuring It.

  • Personalized to your portfolio
  • Live platform walkthrough
  • ROI projection included

Schedule a personalized demo to see Aqueduct monitor air quality, detect gas leaks, automate compliance documentation, and surface insights your quarterly reports miss. We'll show you how to protect occupant health and ensure your facility is always audit-ready with a custom implementation plan and ROI projection.