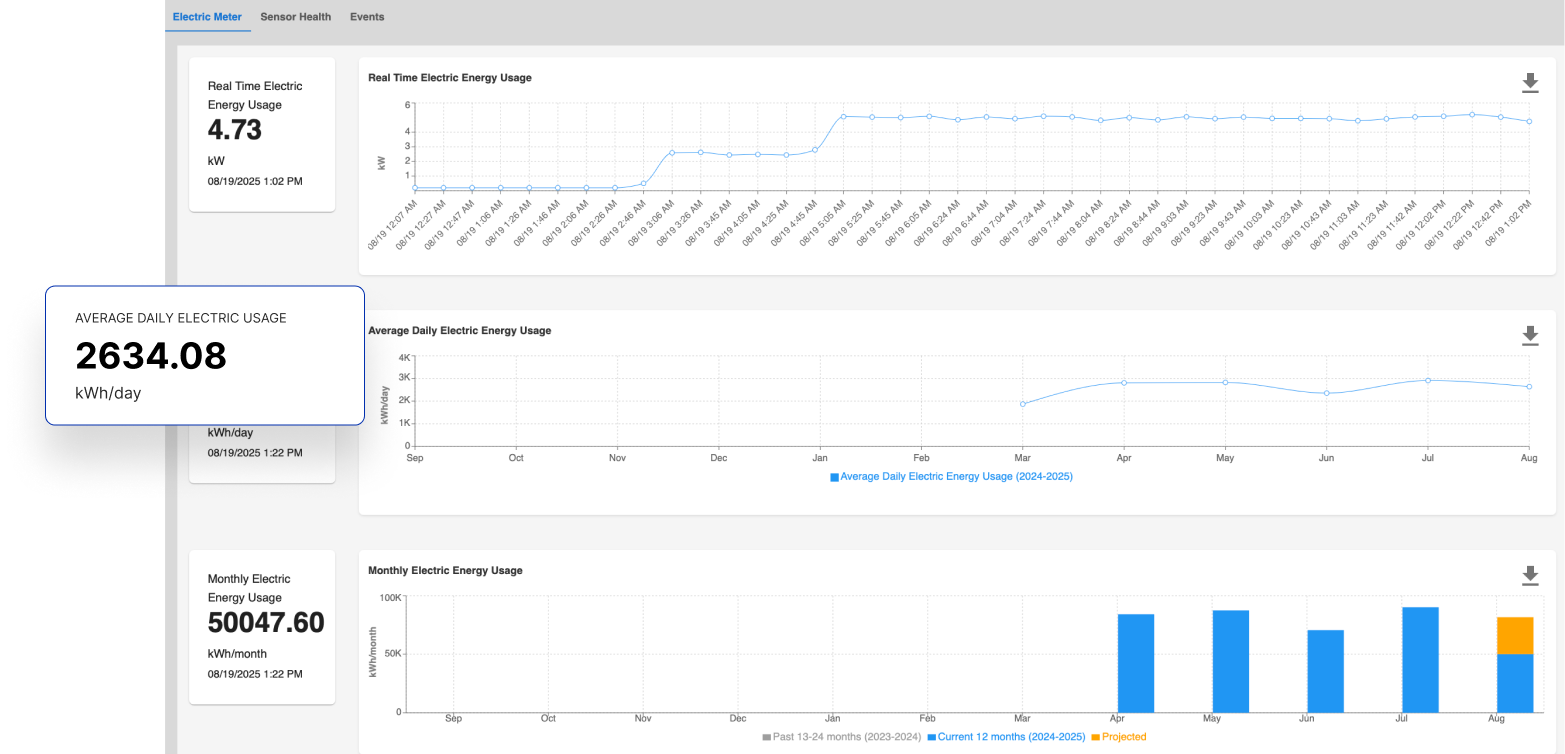
A single monthly kWh number tells you nothing about when you're consuming, how efficiently equipment runs, or where power quality issues are silently degrading infrastructure.
Voltage sags lasting 200ms damage sensitive equipment yet never appear on a bill. Harmonic distortion from VFDs increases cable heating by 30% invisible until a breaker trips. Aqueduct transforms your electrical infrastructure from a cost center into a data asset.
INDUSTRY CHALLENGES
Traditional metering captures consumption totals. Aqueduct captures the behavior, patterns, and anomalies that drive those totals.
Voltage sags, swells, and transients damage equipment silently. Harmonics from VFDs and switching power supplies increase conductor heating. Power factor decay triggers utility penalties. You see the bill increase never the root cause.
Your highest 15-minute demand window sets your utility rate for the entire month. One overlapping startup sequence chillers, compressors, lighting can spike demand charges by thousands. Monthly data can't show you which 15 minutes cost the most.
Motors drawing 15% more current than spec. Phase imbalances stressing windings. Loose connections creating hot spots. Arc fault signatures buried in noise. By the time a breaker trips, the damage multiplier is 3–5× the cost of early intervention.
THE AQUEDUCT APPROACH
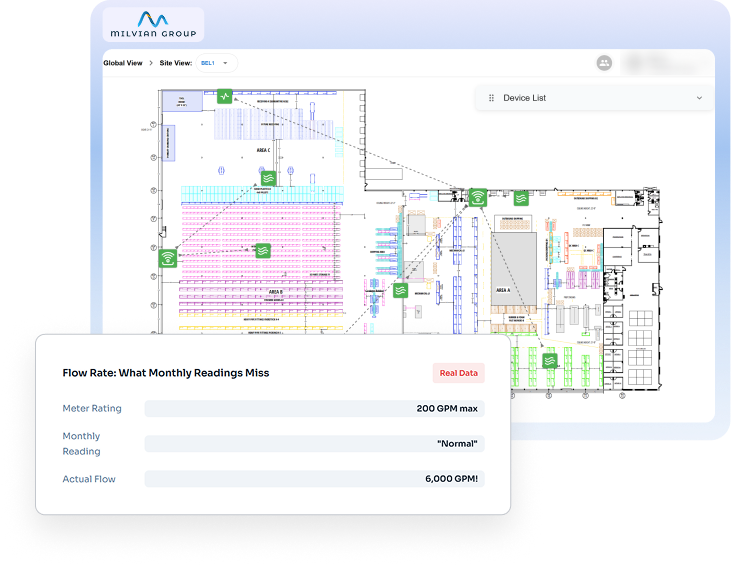
Traditional metering tells you how much. Electrical Observability tells you how, when, why and what's about to go wrong. Sub-minute interval monitoring reveals transient events, degradation patterns, and anomalies that monthly or hourly readings miss entirely.
Capture voltage sags, demand spikes, and transient events invisible to monthly or hourly reads.
AI algorithms detect harmonics, phase imbalance, power factor decay, and anomalous current draw patterns.
No panel modifications. No shutdowns. Split-core CTs install on existing feeders in minutes with zero operational disruption.
Real-time data from electrical rooms where WiFi doesn't reach. Edge processing reduces noise, sends actionable insights.
Unified Infrastructure Intelligence
Avg. energy cost reduction
Transient detection speed
Avg. annual demand savings
Reduction in unplanned downtime
PLATFORM CAPABILITIES
Voltage, current, power factor, harmonics, and equipment health unified in a single dashboard with AI-powered insights.
Industry Insight: The 15-Minute Rule
For most commercial utility tariffs, your highest 15-minute demand window in a billing cycle
sets your demand charge for the entire month often 30–50% of the total bill. A single
simultaneous startup of chillers, compressors, and lighting can spike this window by 20–40%.
Aqueduct monitors these windows in real-time and automates load staggering to prevent demand
spikes. One client saved $47K annually by shifting just three equipment startup sequences by 8
minutes each.
✓ Verified Pilot Results
How Aqueduct identified $312K in annual electrical waste at a multi-building corporate campus issues monthly metering had masked for years.
Fortune 500 Tenant • 4 Buildings • 850,000 sq ft
Panels Monitored
Days to Insights
Critical Issues Found
Operational Disruption
Time to actionable insights
Power infrastructure issues detected
Annual energy waste identified
During non-invasive deployment
Projected investment payback period
Schedule a personalized demo to see Aqueduct detect power quality issues, predict equipment failures, and surface savings you didn't know existed. We'll show you the platform using your specific use cases and provide a custom ROI projection to help turn your electrical infrastructure from a cost center into a data asset.
© 2026 Milvian Group. All rights reserved.