✦ Real-Time Infrastructure Intelligence
Disconnected Assets Drive Unexpected Costs
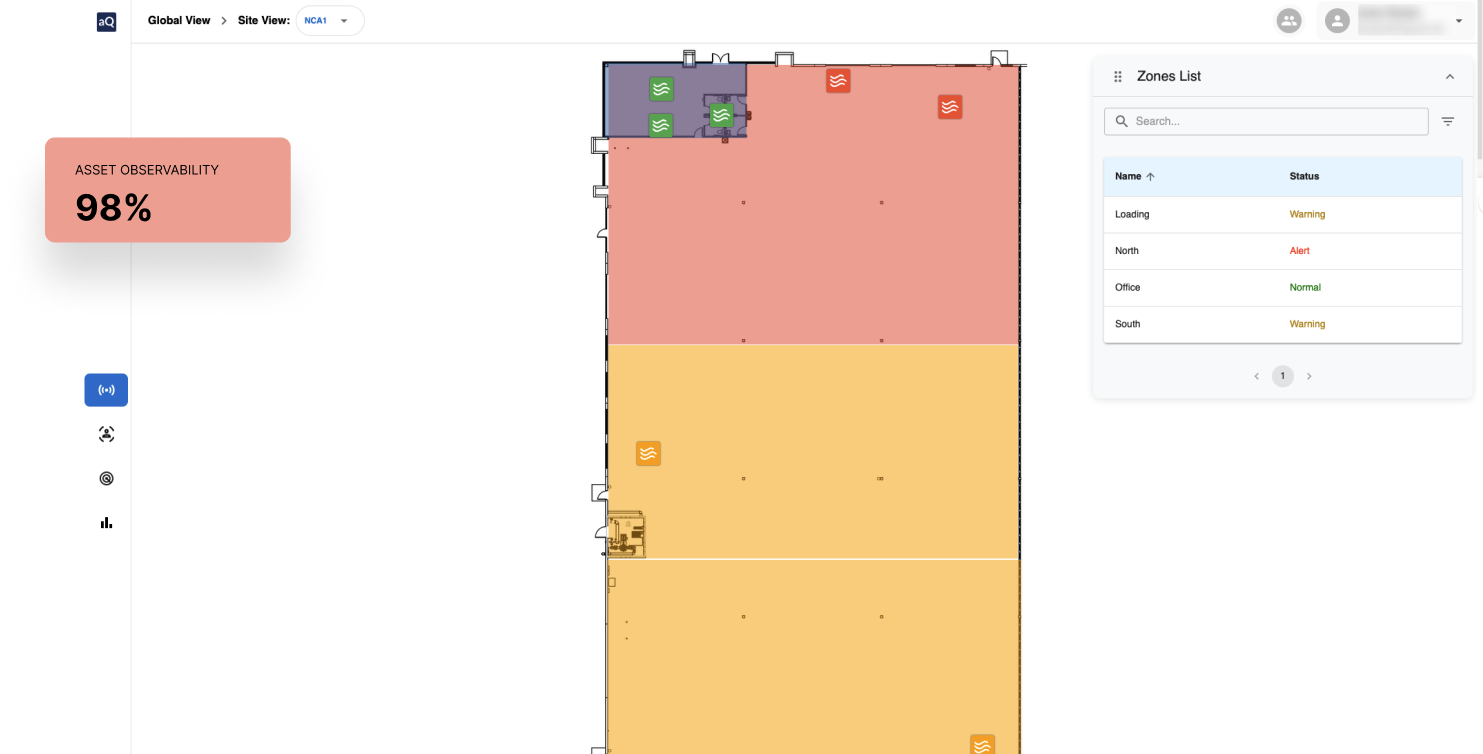
Leaks grow, Equipment degrades. Costs compound. You won't know until the next billing cycle or even worse, the emergency call. Aqueduct gives you real-time infrastructure visibility, detecting anomalies in hours instead of months through turnkey IoT sensor integration and AI-powered analytics
0.25sec
Event detection resolution
<7 days
From install to insights
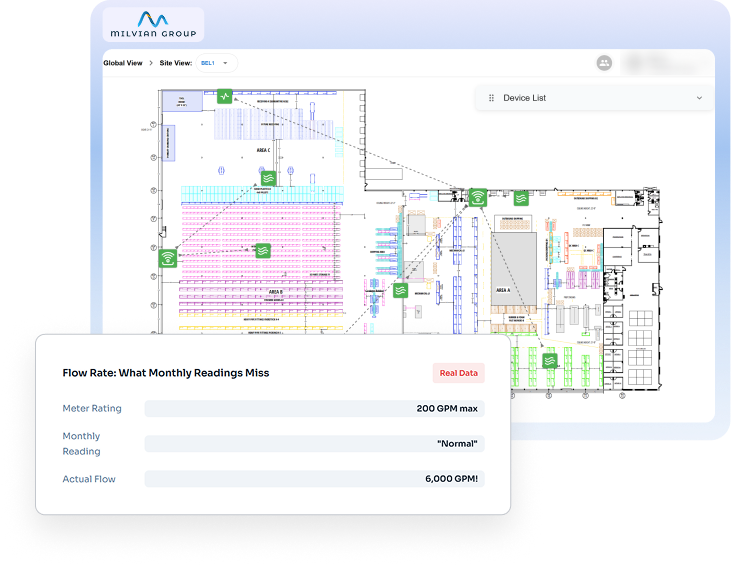
30×
Over-spec detected vs rated capacity